Phase 3.2
Synthesis
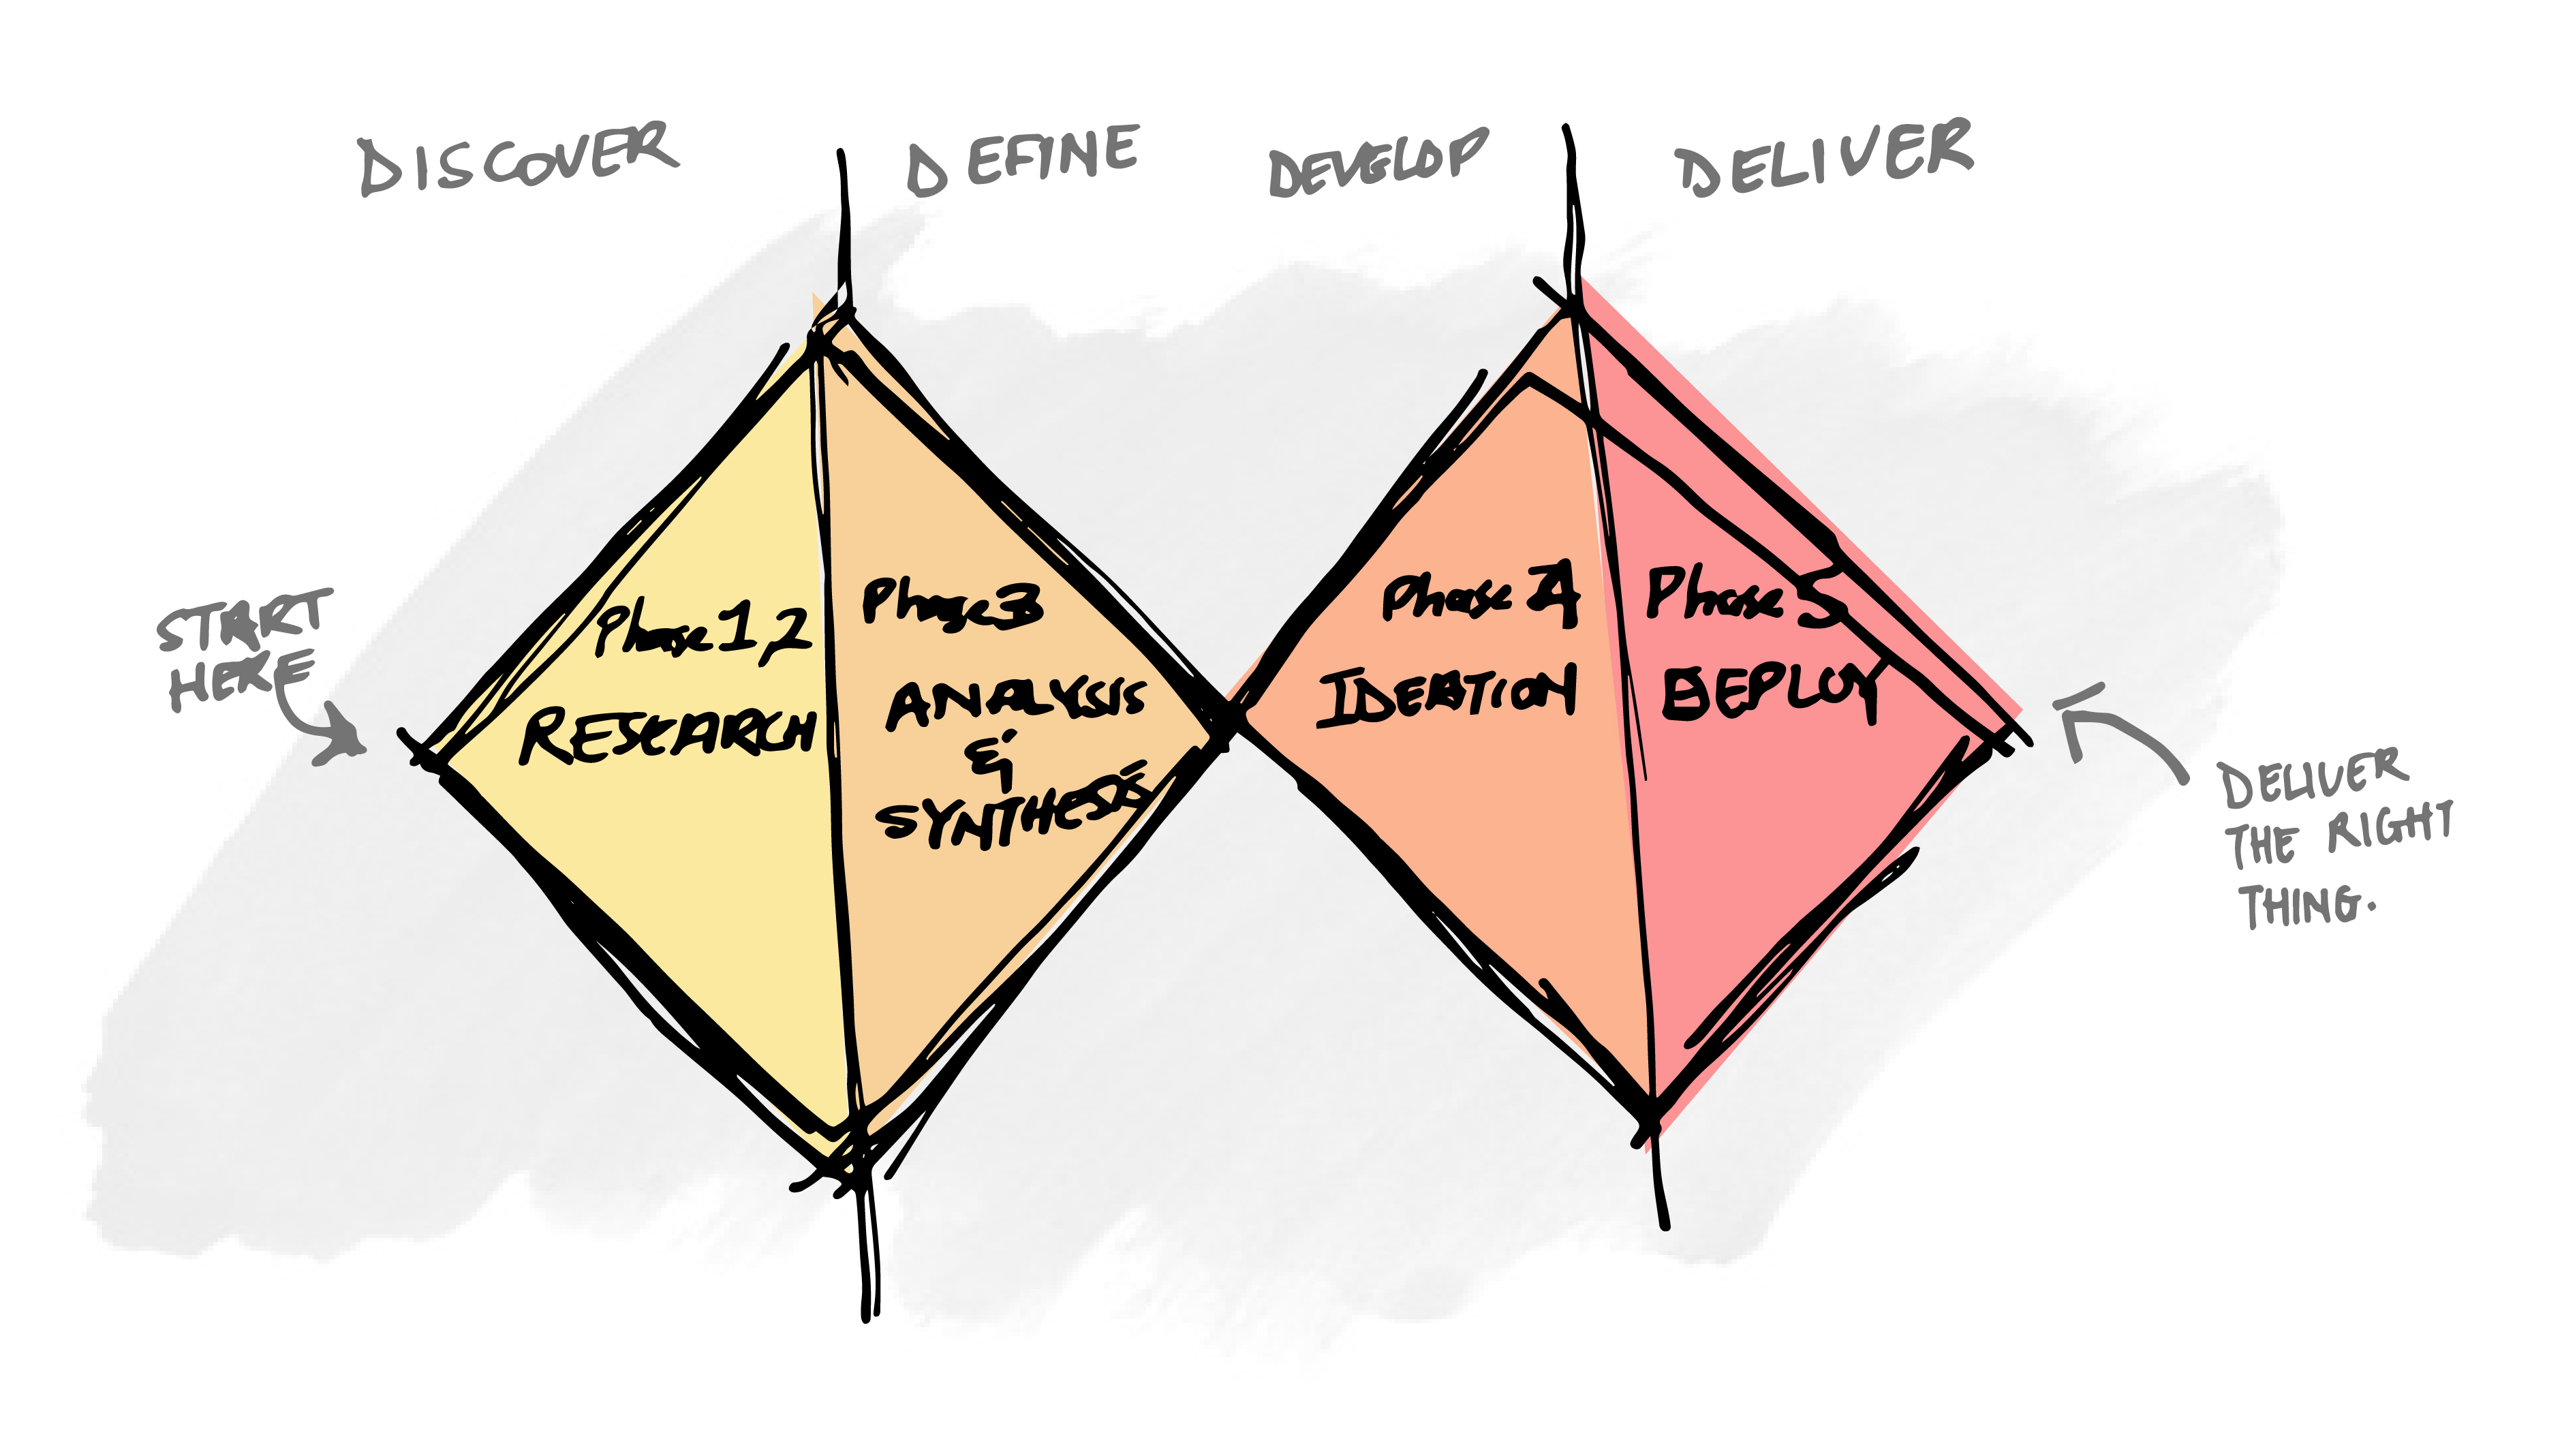
The synthesis phase was where the magic happened. We created a comprehensive insights framework that mapped quantitative trends to qualitative findings, providing a holistic view of the user experience.
This framework allowed us to validate and expand on our Phase 1 findings, adding depth and nuance to our understanding of user needs. Based on this framework, we developed detailed personas that represented our key user segments. These personas went beyond demographic information to capture behavioral patterns, motivations, and pain points, serving as powerful tools for empathy and decision-making in the design process.
We then translated our insights into actionable design opportunities and requirements through the creation of "How Might We" statements. These open-ended questions framed our findings as springboards for innovation, setting the stage for ideation.
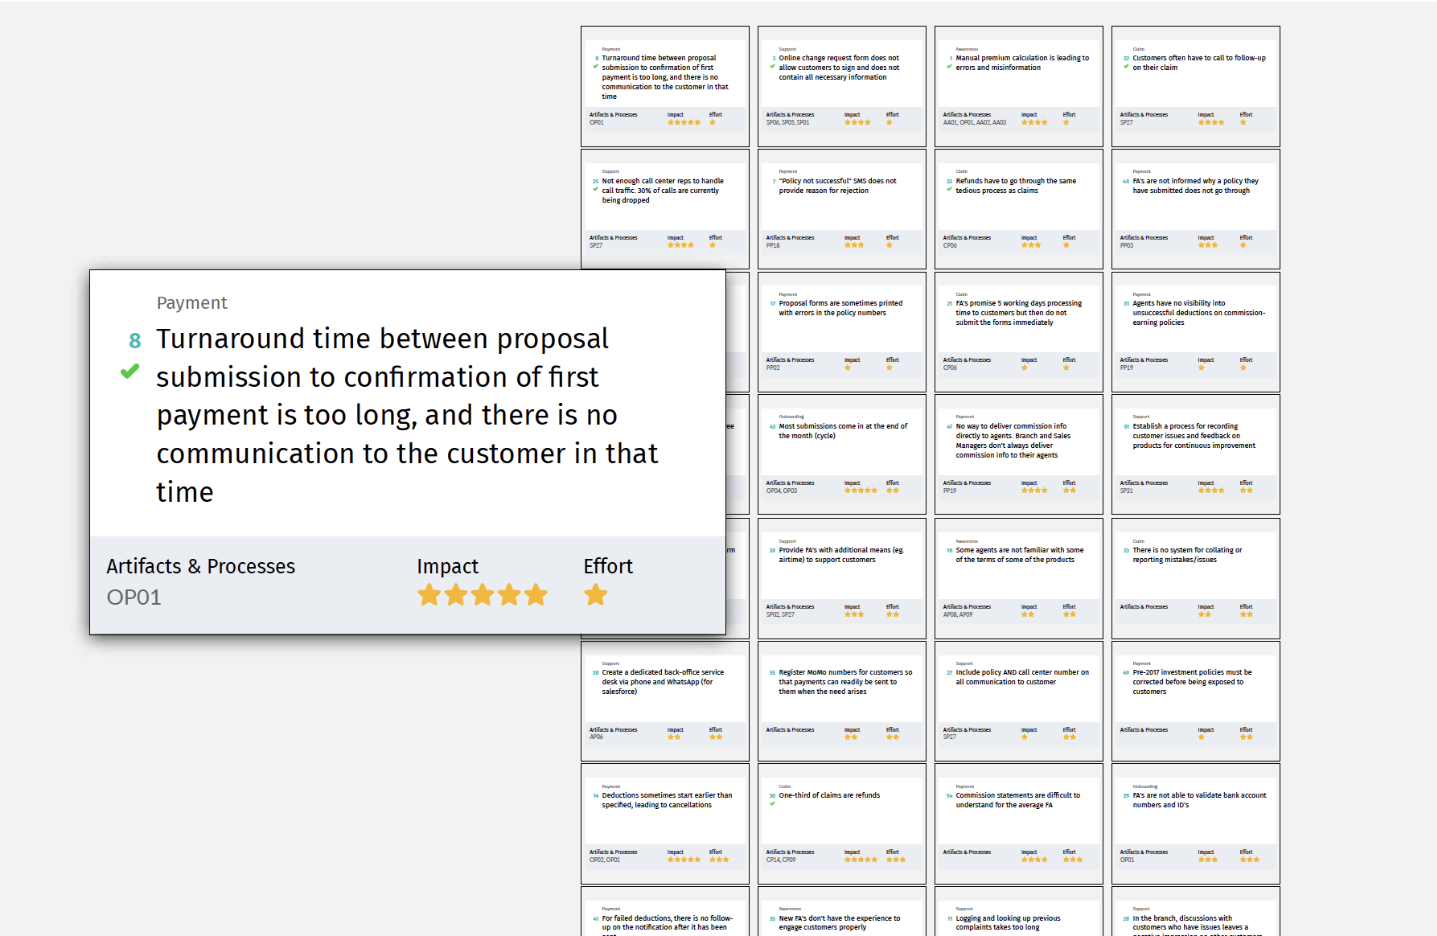
Finally, we prioritized our insights and potential opportunities using an Impact-Effort matrix. This involved a collaborative session with stakeholders to assess each insight's potential impact on user satisfaction and business goals, balanced against the estimated effort required to address it.
Phase 3.2
This is some text inside of a div block.
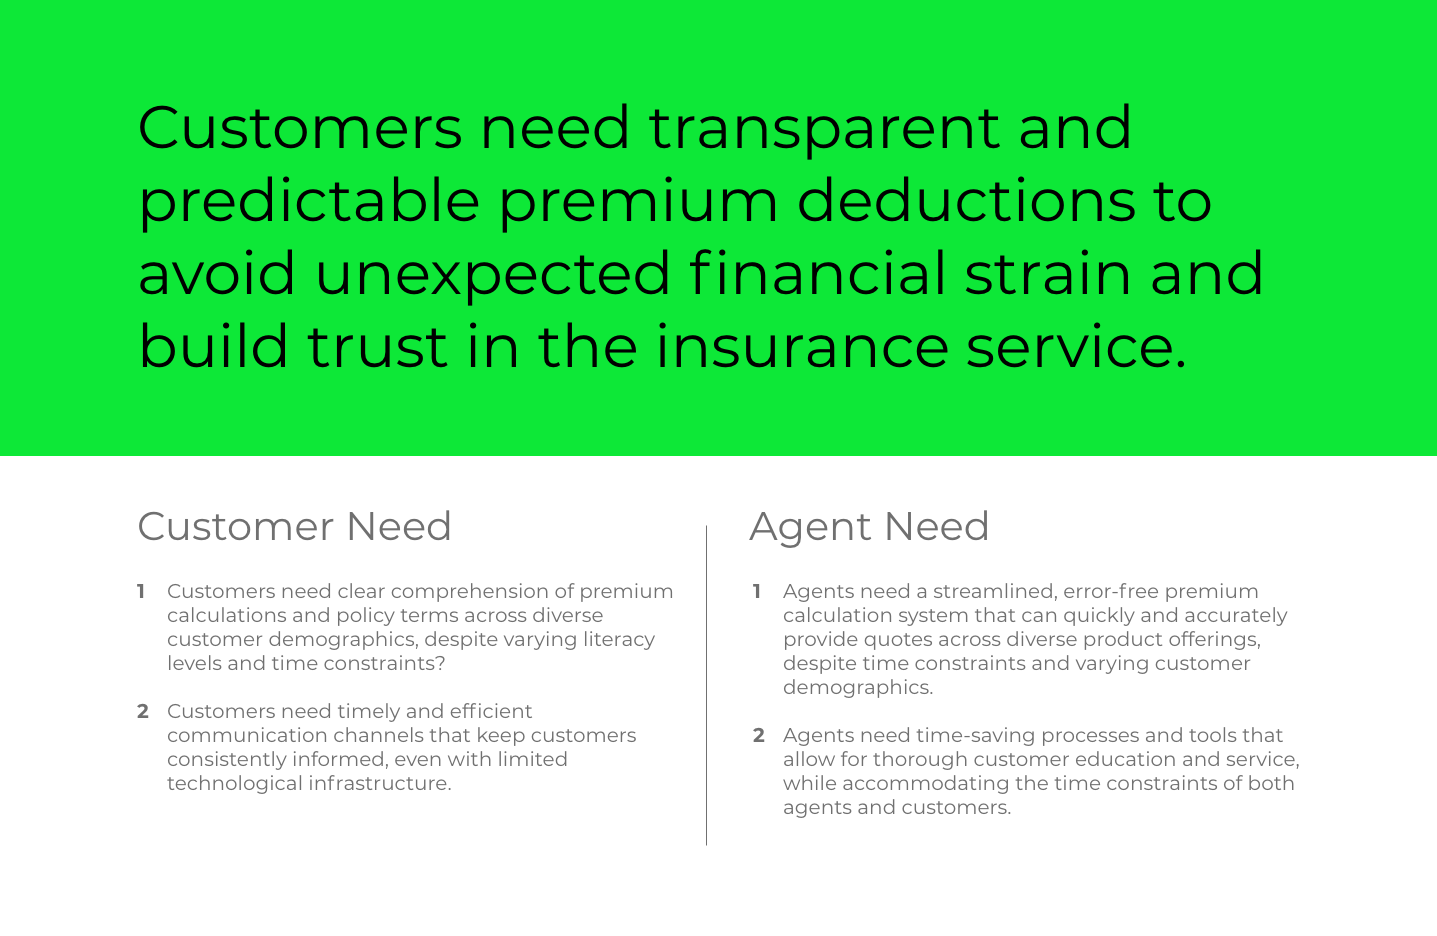
Key Finding: A significant mismatch was identified between the premium deductions customers agreed to and the actual amounts deducted from their accounts.
Context: This insight emerged from the triangulation of quantitative survey data, qualitative interviews, and behavioral observations. It provides a concrete explanation for the observed 35%+ cancellation rate within the first month of sign-up.
Impact: This discrepancy is likely a primary driver of customer dissatisfaction and early policy termination, particularly affecting the growing segment of blue-collar workers who may be more sensitive to unexpected financial fluctuations.
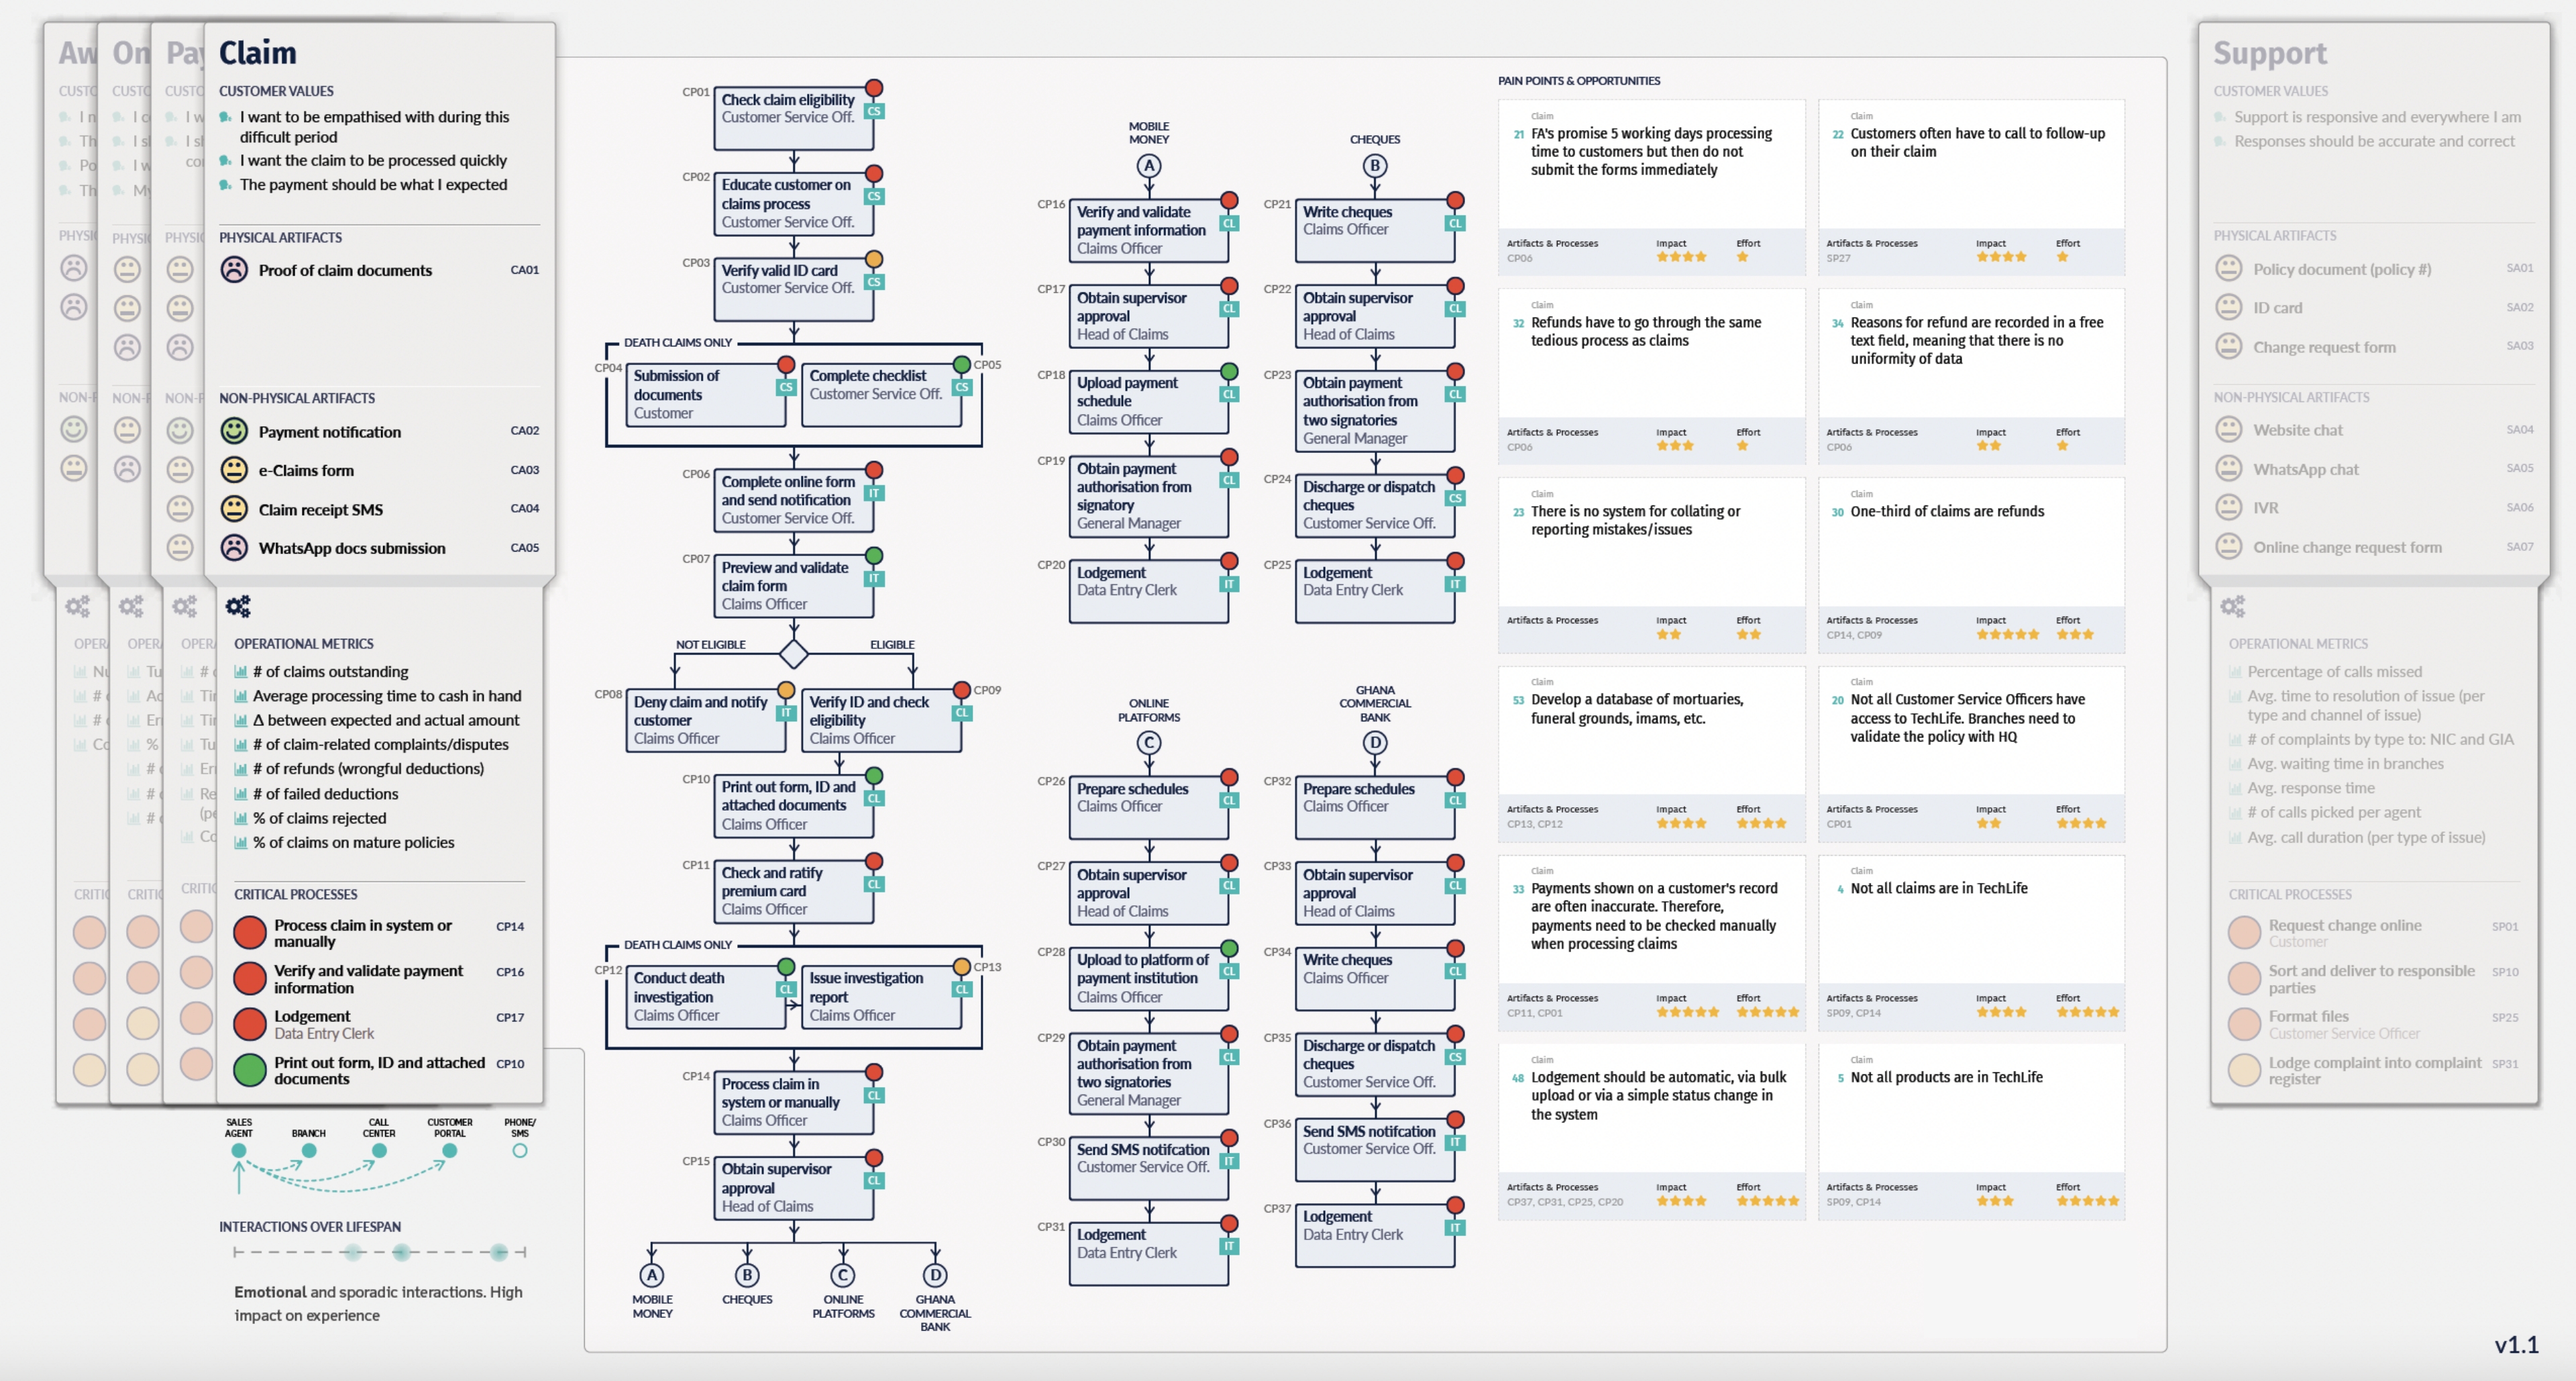
Identifying pain points and opportunities